

On the Laffer Curve

Renowned US economist Arthur Laffer and his famous curve
Maximilian Weber / May 14 2021
(5 min read)
It is perhaps undeniable that the place in the sun that the United States of America enjoy today, as the beneficiaries of a successful economic system that won the Cold War can, at least in part, be owed to the success of the Reagan administration - a regime that placed a strong emphasis on economic deregulation and free markets. One calculation that informed the policy of tax cuts that defined the Republican Party ever since Reagan took office was that of the Laffer Curve, which stipulates that progressive taxation ad infinitum is a bad policy as once taxation exceeds an optimal rate, increasing rates of taxation decreases government revenue and ergo creates a loose-loose policy for both businessmen and the government (Britannica, 2020).
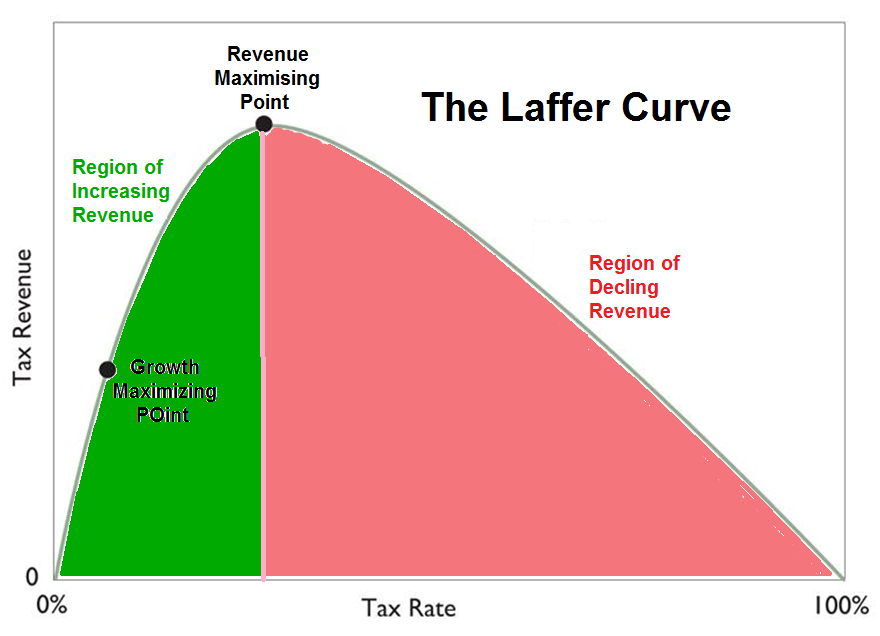
Fig x
Fig. x roughly represents the calculation behind the Laffer Curve. The curve is built by the relation between the x-axis which represents the government’s tax rate imposed on the economy, and the y-axis which represents the potential amount of money collected from taxes. What the curve thus shows is that there is an optimal tax rate that can be reached when the government is designing tax policy, however, everything past that point becomes inefficient as despite the progressively increasing tax rates the government starts collecting less and less revenue.
The argument that can be derived from this calculation is that it is preferable for the government to keep the tax rate at the optimal level, or if that is not possible, to maintain the tax rate on the left side of the optimal tax rate. Why? When observing the curve, we can see that any two points on the curve sharing the same y-axis value, one left of the optimal tax rate and the other on the right side of the optimal tax rate, bring in the same amount of government revenue. However, each of these would be a sum of a different proportion/percentage of taxes levied against the individual. Thus, it would be mathematically sound to deduce that at a hypothetical point z which would be on the left side of the optimal tax rate, the level of economic production would be much higher than at the hypothetical point w which would be on the right side of the optimal economic tax rate. This is because at point w a much higher tax rate is necessary to fill government coffers at the same rate as a much lower tax rate does at point z. What this all seems to imply is that the level of taxation has a direct influence on the economic level of productivity.
The difference in the standard of living for the average person is easy to extrapolate from this calculation and presents a clear case against high tax rates. A person may observe that there is no difference between point z and point w in terms of government revenue, but the services that the government provides are not the only components of an economy. Since at point z a person would be taxed at a low(er) rate, they would be able to enjoy more of their profits, and since the lower taxation level brings in the same amount of revenue as the high(er) tax rates at point w we can also deduce that the total profitable economic production at point z is higher than at point w. This is significant as it shows that when unable to determine the optimal tax rate, it is preferable to opt for lower rather than higher taxes, as lower taxes indicate greater individual use of profits which can then be spent to further stimulate the economy and growth. It also indicates a higher level of profitable economic production, which could mean that the economy itself is run more efficiently. This would mean a higher potential GDP and GDP, as at either at full or actual employment, as higher profitability would indicate higher productivity and efficiency.
This reality was also reflected during the Reagan administration. The Reagan tax cuts were predicted by many economists to have a disastrous result for government revenue. However, as Encyclopaedia Brittanica (2020) writes, the actual results were the opposite:
“Reagan’s economists projected a large revenue loss from his tax cuts, but they too were wrong: the actual revenue loss was less than had been projected, largely because the cuts in tax rates gave individuals an incentive to earn more taxable income”
Because economic calculation is difficult from the central point of view, the Reagan administration still lost some money due to the cuts, but nowhere nearly as many as predicted by certain doom-sayers. Furthermore, the mathematical calculation of the Laffer curve was also proven to be empirically correct, with economic production increasing under the Reagan administration, leading to improved standards of living and lower unemployment as a result of greater economic activity (Amadeo, 2011).
In conclusion, as a government policymaker, I would advocate for adherence to the Laffer Curve and sticking as closely as possible to the ideal tax rate. However, since it is very hard to estimate the actual ideal tax rate from the perspective of a central director, I would strongly urge to round down rather than up when designing the policy, as the Laffer Curve’s mathematics clearly demonstrate that over-taxing does more damage than under-taxing, not only in terms of government revenue but also in terms of total economic productivity.
Bibliography
Britannica, T. Editors of Encyclopaedia (2020, August 10). Arthur Laffer. Encyclopedia Britannica. https://www.britannica.com/biography/Arthur-Laffer
Amadeo, K. (2011, November 10). President Ronald Reagan’s Economic Policies. The Balance; The Balance. https://www.thebalance.com/president-ronald-reagan-s-economic-policies-3305568

